Once a user has answered any number of questions in your survey, the data will be sent to your Asklayer account and can be viewed as charts.
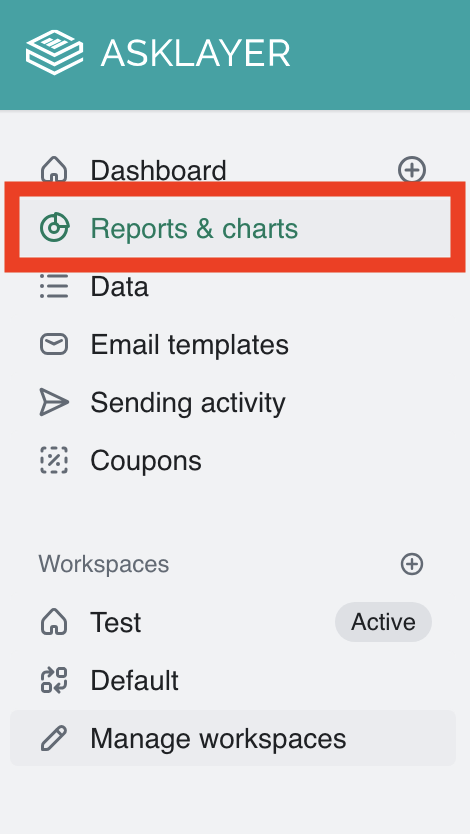
Locate and click 'Reports & charts' in the Asklayer dashboard.
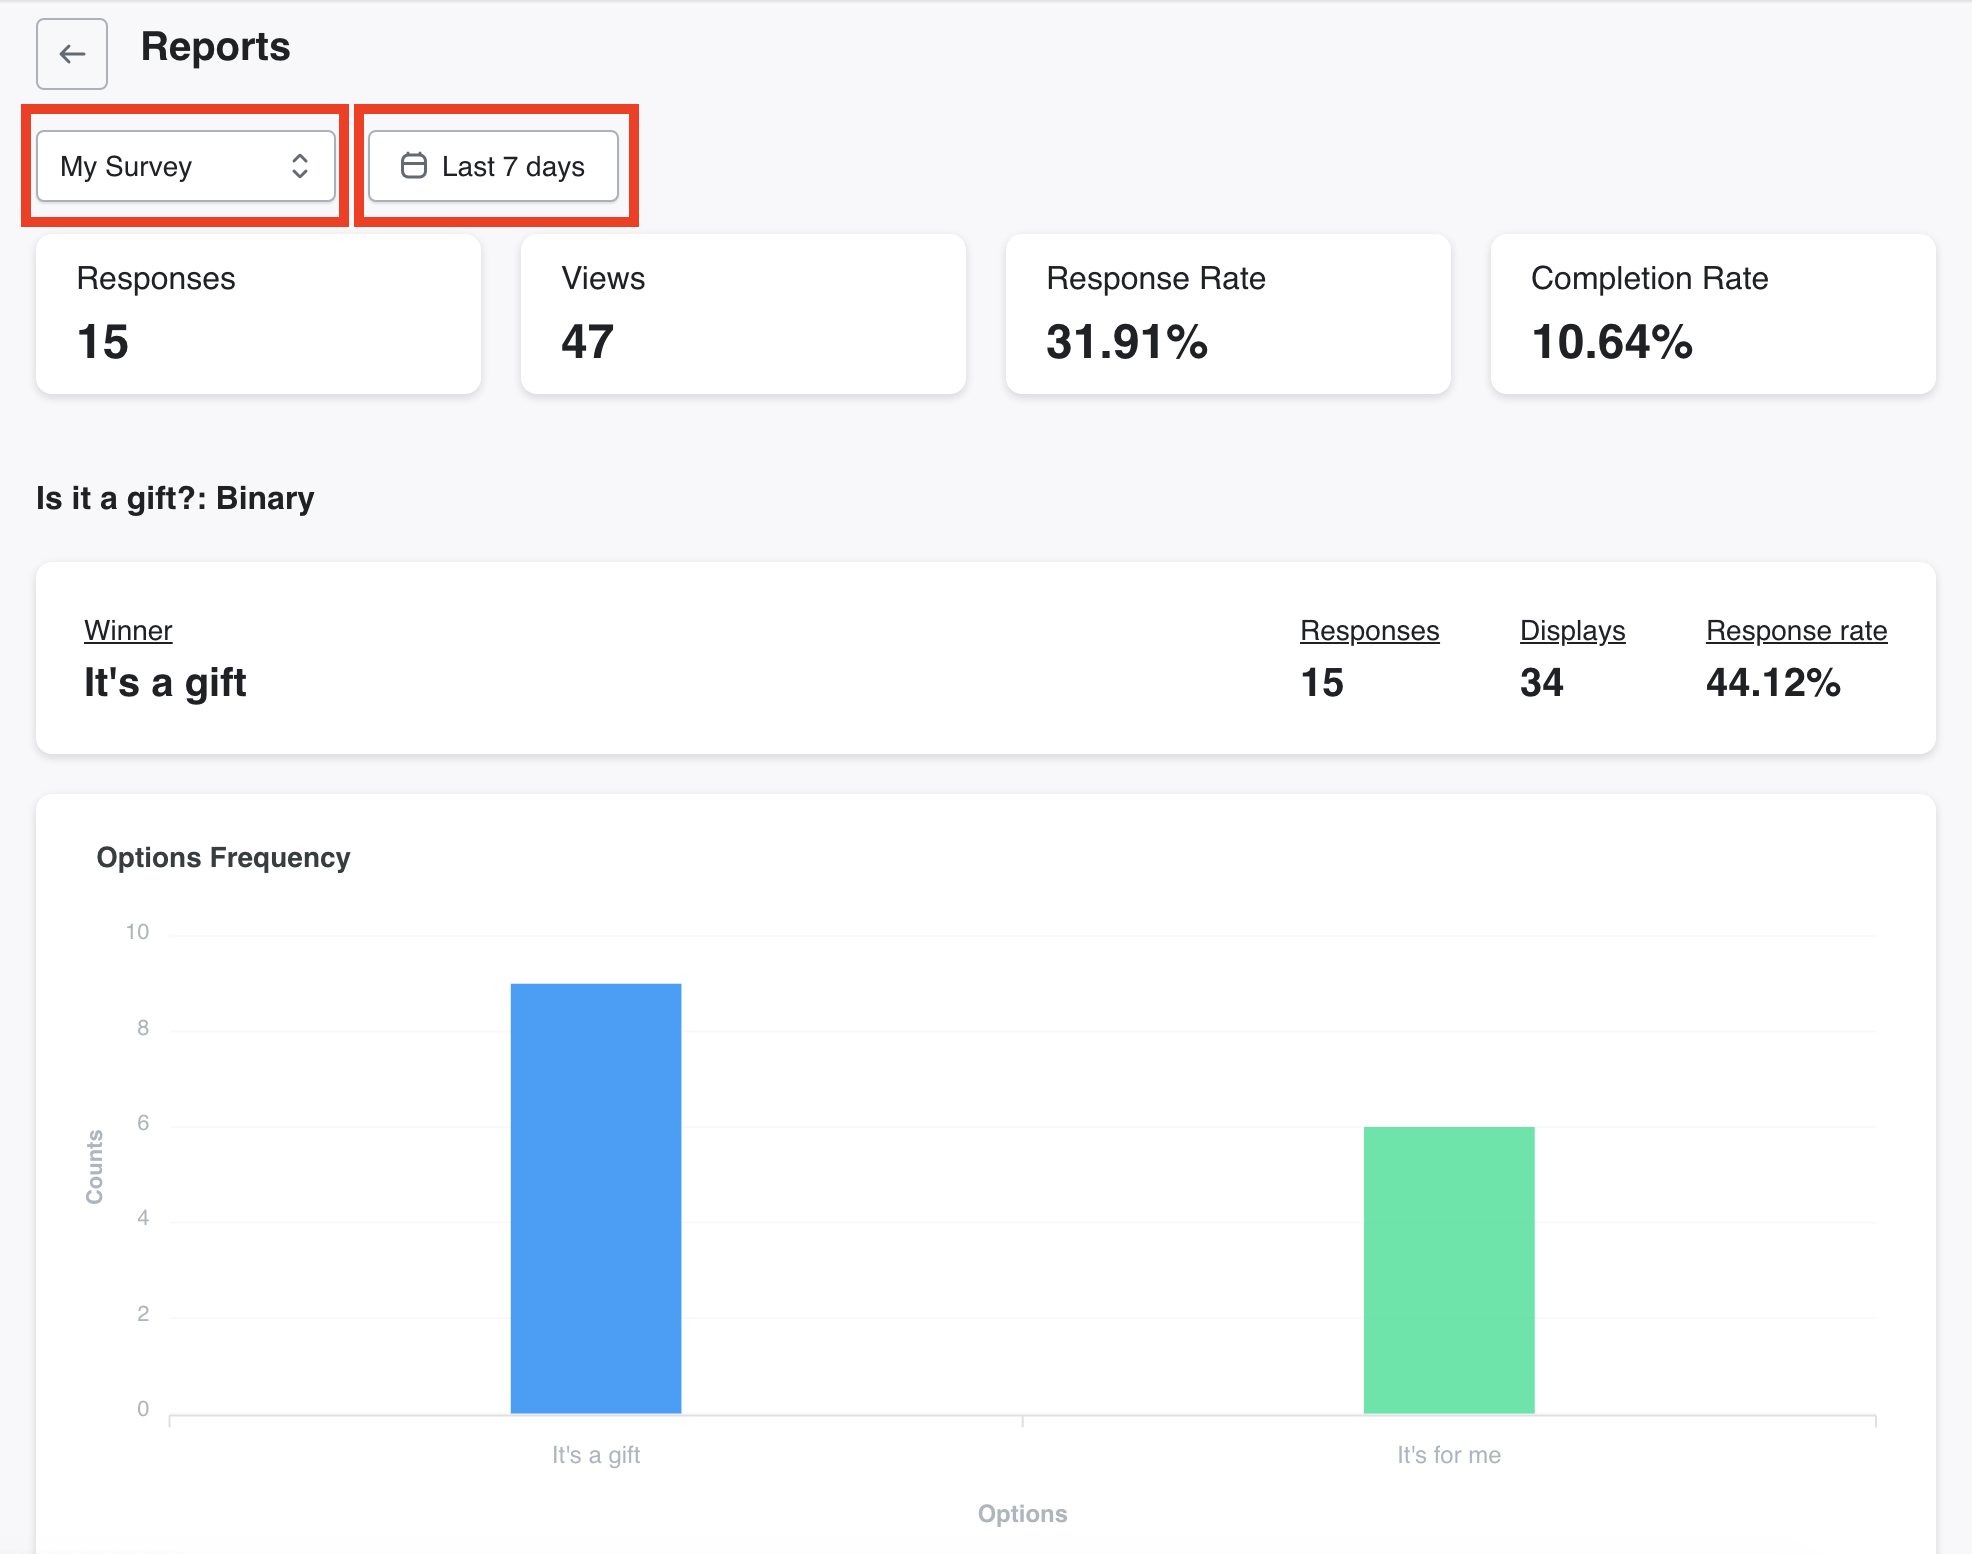
Select the survey you'd like to see the results of and the time frame the graphs will represent.
Scroll down to see results and graphs of each page of your survey that have received answers.


